
How to Track Cash Flow in Excel: A Step-by-Step Guide
Cash flow is the difference between a business that survives a slow quarter and one that does not. This guide shows exactly how to structure a cash flow spreadsheet in Excel, which formulas to use, how to forecast the next quarter and which mistakes quietly break most sheets.
Building the sheet, step by step
1. Set up a single transactions sheet
Use one flat table with one row per movement and columns for Date, Description, Category, Account, Inflow and Outflow. Never split months into separate tabs — a single table is what makes every report and chart possible with SUMIFS and pivot tables.
2. Define a short category list
Keep 10 to 20 categories such as Sales, Refunds, Payroll, Rent, Suppliers, Taxes and Loan repayments. Drive the Category column with data validation so spelling stays consistent, otherwise your totals silently break.
3. Build the monthly summary with SUMIFS
On a summary sheet, list categories down the rows and months across the columns, then use SUMIFS on the transactions table filtered by category and by month start and end dates. Total inflows minus total outflows gives net cash movement per month.
4. Add opening and closing balances
Enter the opening bank balance for the first month. Each following month opens with the previous closing balance, and the closing balance equals the opening balance plus net movement. This running balance is the number that tells you whether you can pay next month's bills.
5. Forecast the next 8 to 13 weeks
Copy the summary structure into a forecast block and enter expected receipts and payments: recurring costs, payroll dates, tax deadlines and invoices due. Compare forecast against actual each week so your assumptions get sharper over time.
6. Turn it into a dashboard
Add a line chart of the closing balance over time, a bar chart of inflows versus outflows, and conditional formatting that turns any negative closing balance red. One screen should answer: how much cash do I have, and when does it run out?
The minimum column structure
| Column | Why it matters |
|---|---|
| Date | Use the date the money actually moves, not the invoice date. |
| Description | Free text so you can audit a line months later. |
| Category | Data-validated list; drives every SUMIFS total. |
| Account | Separates bank accounts, cards and cash. |
| Inflow | Money received, always positive. |
| Outflow | Money paid, always positive in its own column. |
| Net | Inflow minus outflow; feeds the running balance. |
Five mistakes that break cash flow spreadsheets
- Mixing personal and business movements in the same sheet.
- Recording invoices on the issue date instead of the payment date — that is profit, not cash.
- Hard-coding totals instead of using SUMIFS, so new rows are never counted.
- Forgetting quarterly or annual payments such as taxes, insurance and software renewals.
- Keeping no forecast at all, which turns cash management into a reaction instead of a plan.
Ready-made cash flow templates from X4Plan
If you would rather start from a finished model, these X4Plan spreadsheets already include the structure, formulas and dashboard described above. Each one opens on our official Etsy store.
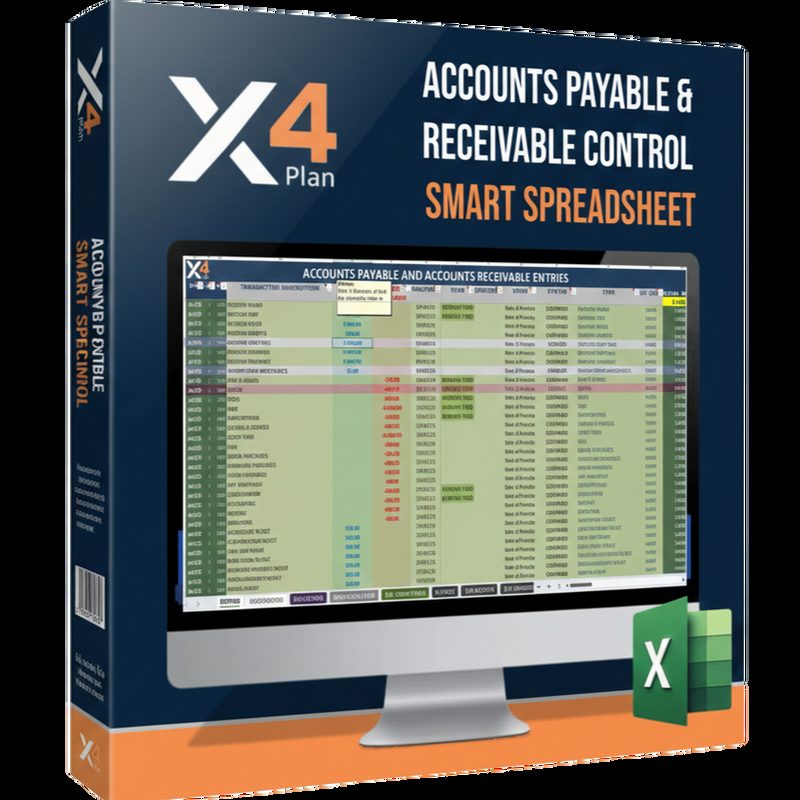
Smart Excel Spreadsheet for Accounts Payable Receivable – Automate Cash Flow P&L
AP and AR entries feed cash flow and profit & loss views automatically, so one set of records drives several reports.
One entry updates payables, receivables and cash flow.
- Type:
- Excel Template
- Best for:
- Growing businesses managing AP/AR in Excel

Advanced Cash Flow and Bank Reconciliation Excel Spreadsheet for Personal or Business Finance
Cash flow tracking paired with bank reconciliation, usable for either a household or a company ledger.
Match the bank and read cash flow in the same file.
- Type:
- Excel Template
- Best for:
- Anyone reconciling accounts and forecasting cash
Smart Financial Control Excel Spreadsheet with Bank Reconciliation, Cash Flow and Dashboard
A compact financial control file combining reconciliation, cash flow and a dashboard summary of the period.
See control, cash and reporting on one screen.
- Type:
- Excel Template
- Best for:
- Small and mid-sized businesses
Cash flow in Excel — Frequently Asked Questions
- What is the difference between cash flow and profit?
- Profit is revenue minus expenses over a period, recognized when they are earned or incurred. Cash flow is the money that actually moves in and out of your bank account. A profitable business can still run out of cash when customers pay late or stock is bought up front, which is why cash flow needs its own tracking sheet.
- Which Excel formulas do I need to track cash flow?
- The core set is SUMIFS for totalling inflows and outflows by month and category, a simple running balance (previous closing balance plus net movement), TEXT or EOMONTH to group transactions by period, and XLOOKUP to pull category or account names. Conditional formatting highlights negative closing balances.
- How often should I update a cash flow spreadsheet?
- Weekly is enough for most small businesses, with a daily update in tight periods. Import or paste bank transactions, categorize them, and check the projected closing balance for the next 8 to 13 weeks.
- Can Excel replace accounting software for cash flow?
- Excel is excellent for forecasting, scenario testing and short-term cash visibility because you control every assumption. It does not replace bookkeeping or tax compliance, so most teams use accounting software for the ledger and Excel for planning and cash control.
- Is a template better than building the sheet myself?
- Building it yourself teaches you the mechanics; a template saves the setup time and comes with the formulas, categories and dashboard already wired. The X4Plan cash flow templates on Etsy are built for that second case and download instantly.
Skip the setup and start from a finished cash flow model
Download an X4Plan cash flow spreadsheet on Etsy with the transactions table, monthly summary, running balance and dashboard already built.